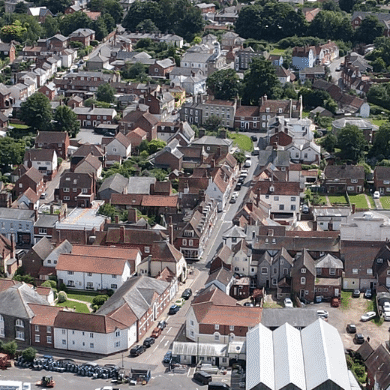
Stretching from Harlow to Harwich, Essex is one of the largest counties in England. With a population of nearly 1.5 million, it is also one of the fastest-growing.
Every day, thousands of people make journeys across the county, its borders, and into London to access work, education, health services, and leisure activities. Many also travel to and from Essex via its major international gateways, including London Stansted Airport, the UK’s fourth-busiest airport - and the Port of Harwich.
These are just a few reasons why it is essential to understand how people living and working in Essex are making their journeys. This insight will help support future economic growth, meet net zero ambitions, and enable residents of the county to thrive.
We surveyed people from across the East, asking about they travel behaviour, choices and reasons for travelling. Insights for Essex from the survey have been compiled into a comprehensive report, available below.
How and where was the survey conducted?
- A 25-minute online survey was conducted between 18 March - 17 April 2024.
- In Essex, 1,488 people responded to the survey from across the county's districts.
- Demographics were not controlled for when recruiting respondents. This means the data in the report is weighted to reflect the relative sizes of age and gender groups from the Census for each district.
- Southend-on-Sea and Thurrock are separate Local Transport Authorities from Essex and have their own individual reports.
What did the survey tell us?
Car journeys and walking are the most used modes of transport across all journey purposes.
7% of respondees choose cycling for their journey, yet 36% of respondents have access to a bike.
14% of respondents use rail, however 32% have easy access to a station.
25% of respondents use the bus, making it the third most used mode of transport.
Active Travel: Walking, Wheeling and Cycling
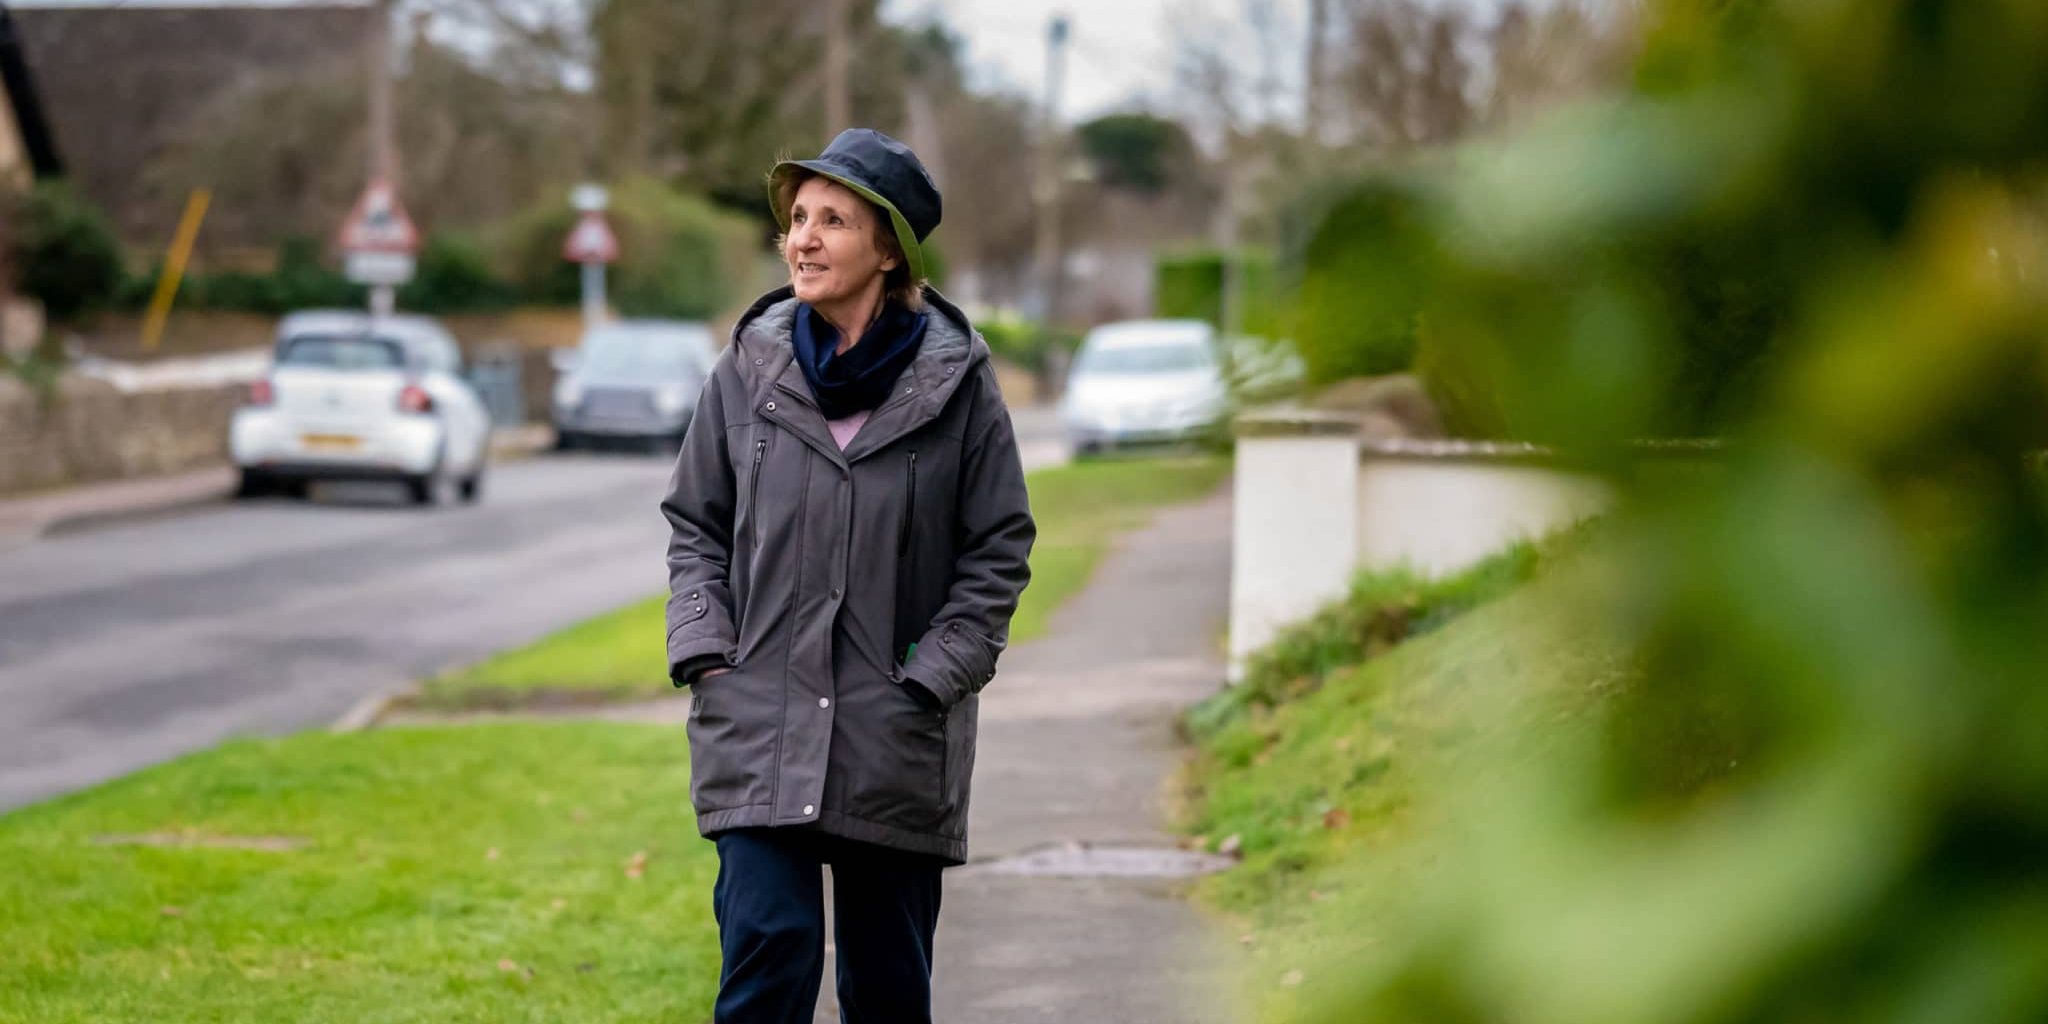
- Most journeys are made by walking, and this is likely to remain the case during the 12 months following the survey.
- For those who don't regularly walk, 24% of respondents identified time constraints as a major barrier. Safety concerns regarding pavement lighting were raised by 24% of respondents, while 23% said fitness levels influenced their choice.
- 66% of respondents perceive walking as important for making more sustainable travel choices, and 60% support further investment in infrastructure to make walking easier.

- Despite 36% of respondents owning a bicycle, only 7% report using it as a mode of transport in a typical week.
- The key barrier and concern for respondents is safety, with road traffic being the top issue, cited by 42%. Weather and the lighting of cycle routes were other common reasons for not choosing cycling.
- Looking ahead, 20% of respondents want to cycle more in the future, but segregated cycle lanes and improved lighting are important to achieve this.
Driving, Roads and Electric Vehicle uptake
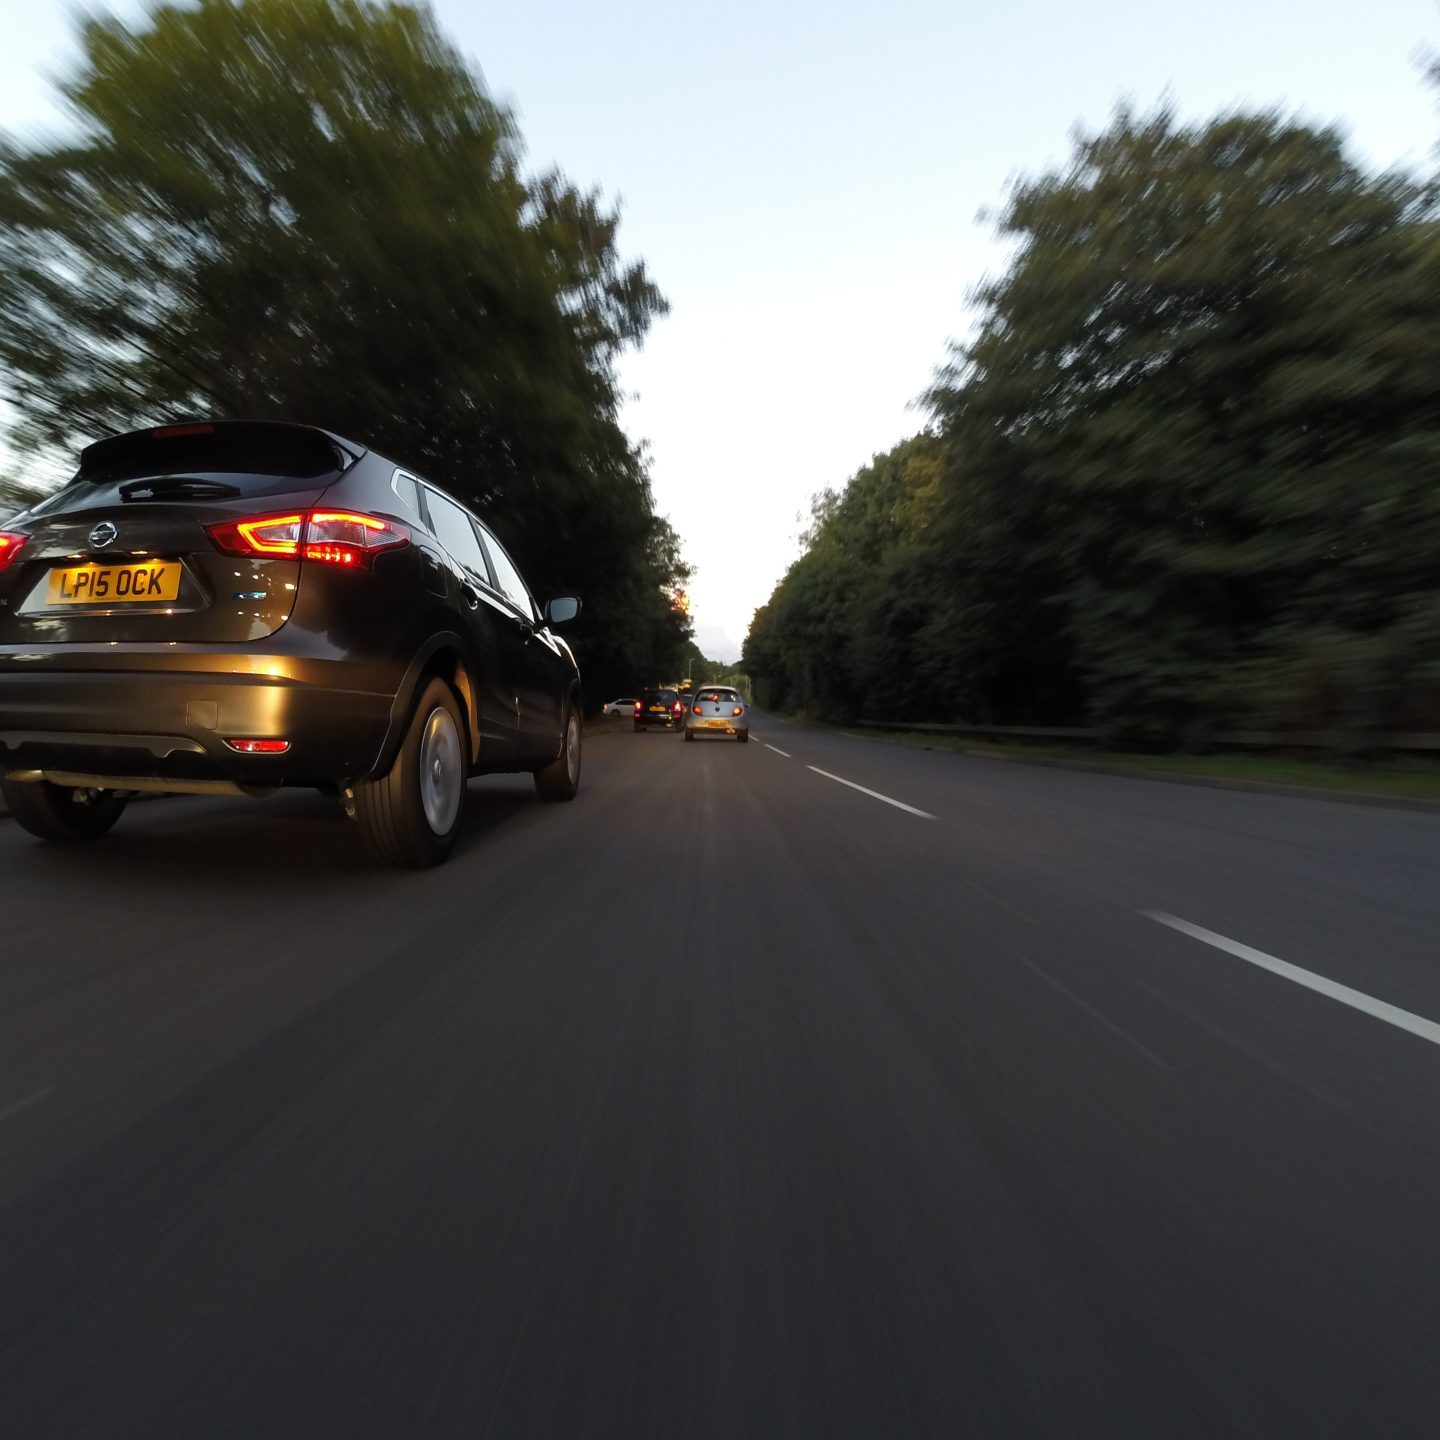
- The car is likely to be the second most used mode of transport in the 12 months following the survey.
- One key reason for this is convenience—62% for drivers and 55% for passengers.
- Parents often use a car to take their children to school, as time constraints or distance limit alternative travel options.
- Cars are also commonly used as the main way to get to the airport when going on holiday.
- Only 16% of car users reported being satisfied with the condition of roads.
- Currently, 6% of car users own an electric vehicle (EV) or plug-in hybrid.
- But, 29% of respondents indicate they intend to purchase or lease an EV in the next five years. However, 56% of those surveyed said the costs associated with purchasing an EV are the biggest barrier.
Public Transport: Bus and Rail
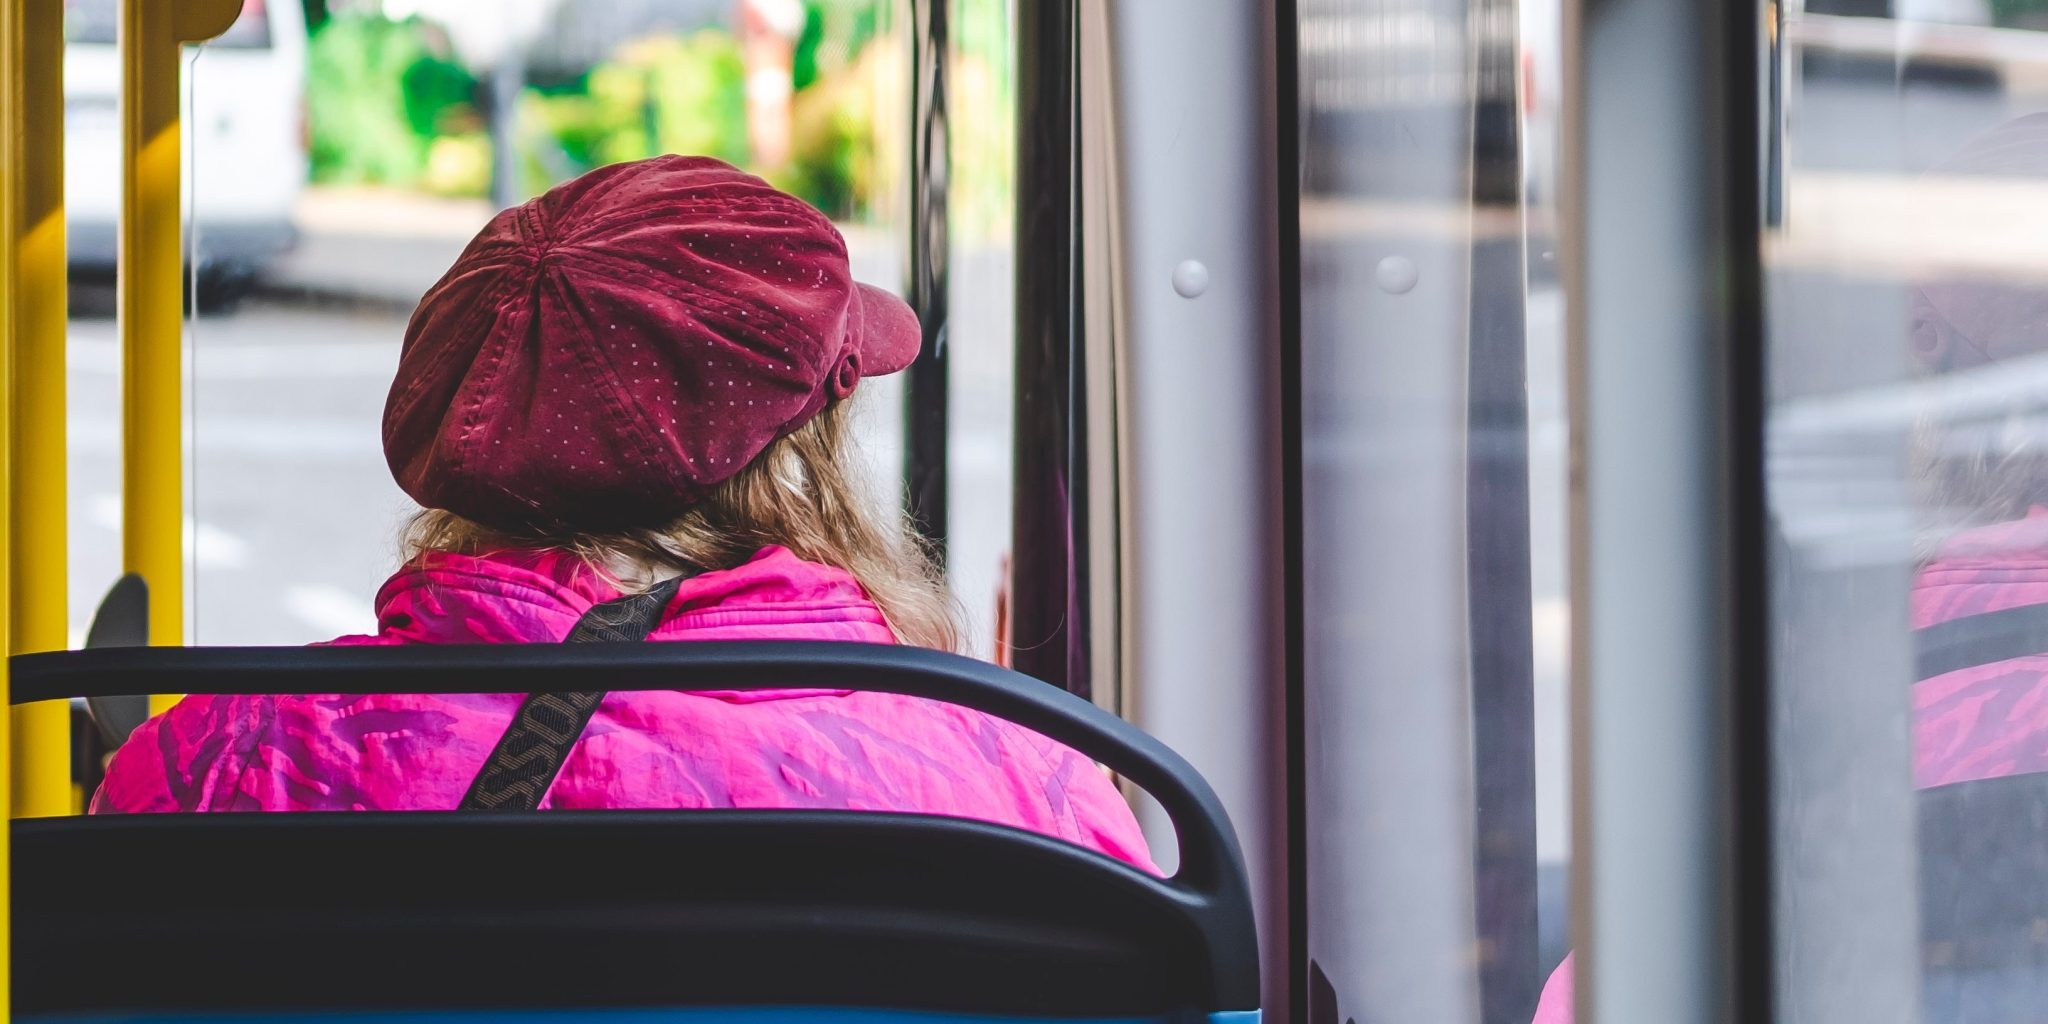
- The bus is the most used mode of public transport, with 25% of respondents using it, primarily for commuting to work.
- The biggest barrier to traveling by bus for 47% of respondents is inconvenient and non-direct routes.
- Another barrier for not choosing buses is the limited number of early or late services - 29% of respondents are dissatisfied with availability in their area.
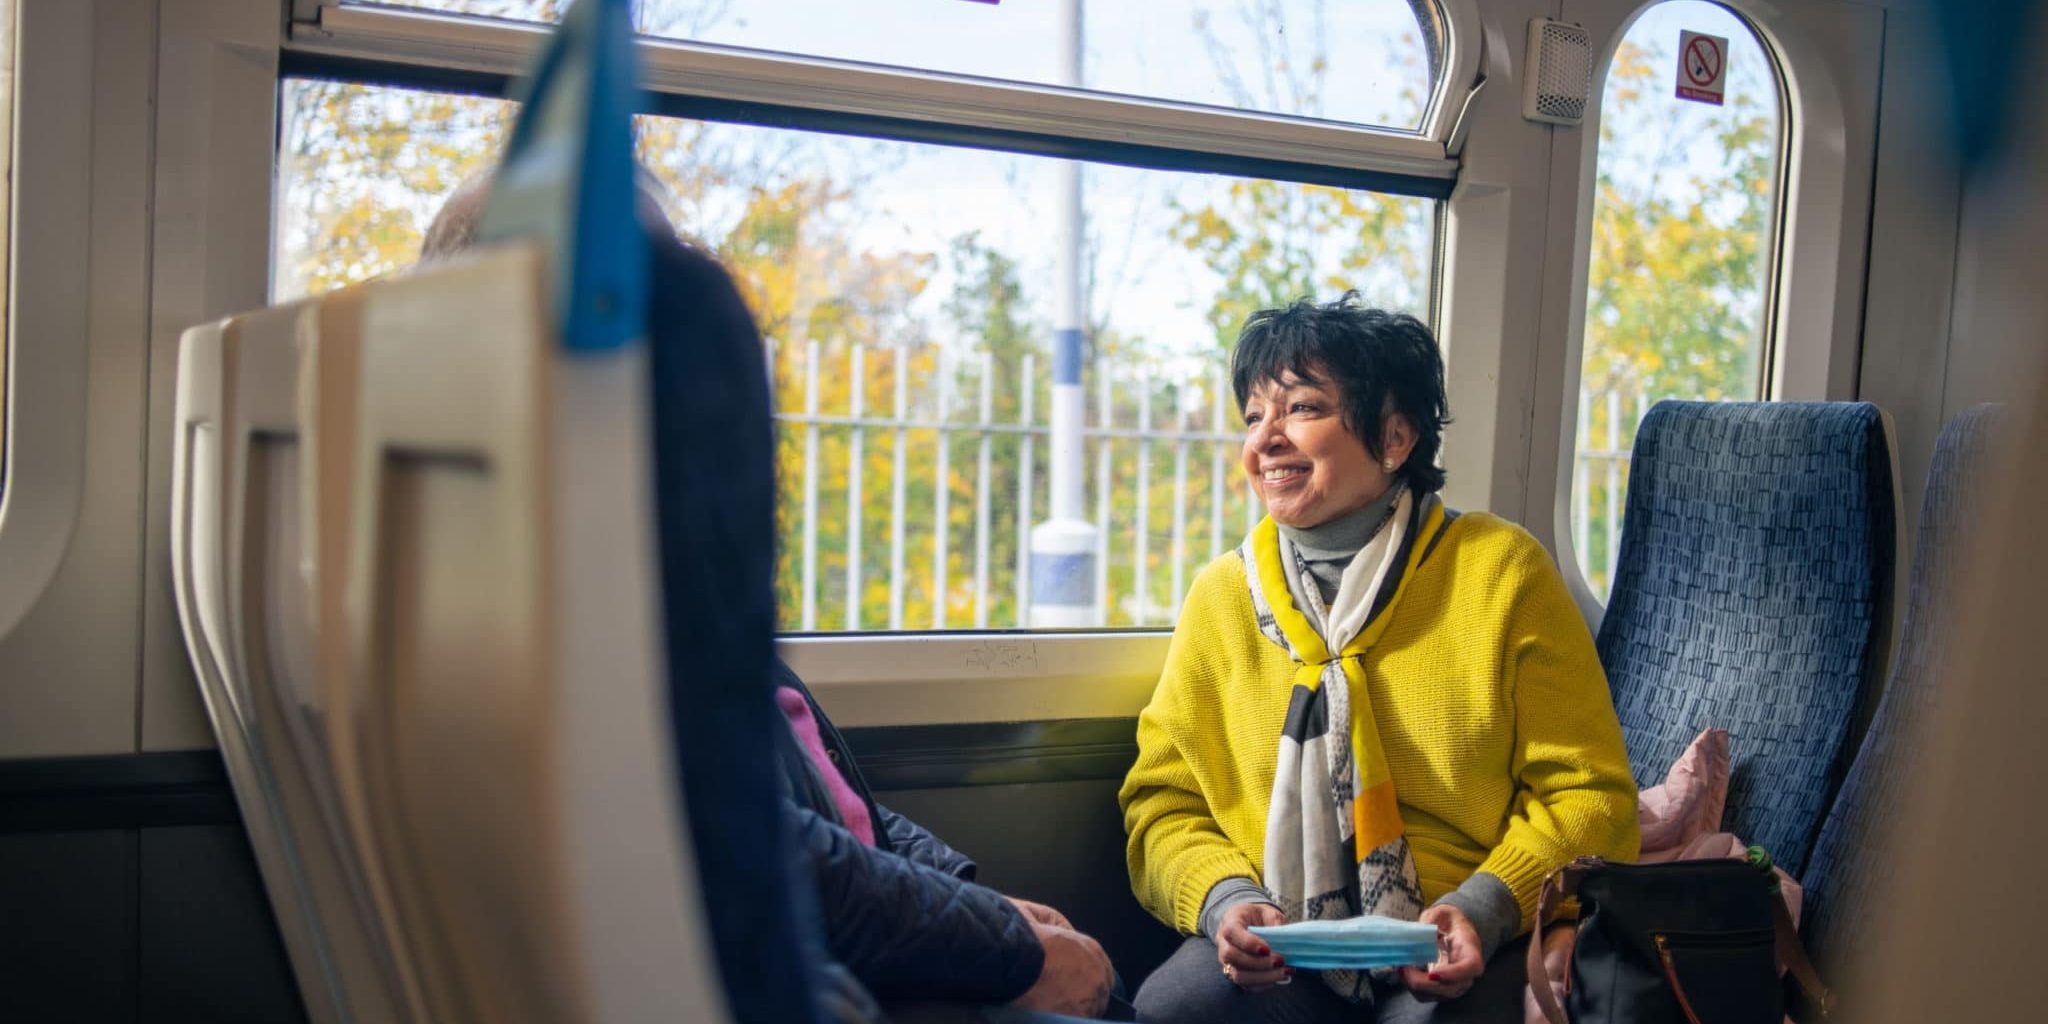
- 14% of Essex respondents regularly use the train, but answers suggest this could significantly increase to 54% in the future.
- 65% of respondents are satisfied with local rail services in Essex.
- However, 53% of all train users are dissatisfied with the cost of using the rail, which creates a barrier to choosing this mode of transport.
Additional Information
How travel and transport impacts current work and shopping behaviours
65% of Essex respondents are currently working in a typical week - one of the key reasons people are making journeys. Of this group, only 6% work from home full-time, while the rest travel to their workplace all or some of the time. The average commute currently takes 33 minutes, with 66% of respondents starting and finishing their journeys within Essex.
47% of respondents visit their nearest town or city for non-food shopping, yet 85% also use home deliveries regularly or occasionally.
Views on travel and climate change
67% of respondents believe that, in general, it is important to travel sustainably. However, only 41% agree that sustainable travel is personally important to them, and just 33% consider themselves to be currently using sustainable transport options. This suggests that while respondents value sustainable travel, they are not actively adopting it in their daily routines.
Respondents expressed interest in schemes that could make a difference, such as quieter neighbourhoods with reduced traffic, clean air zones, additional public transport routes with reduced fares, and improved active travel infrastructure.
Views on funding priorities
Respondents identified the top three funding priorities as:
- Improving road conditions
- Increasing the number of public transport services
- Upgrading footways
In a scenario where road charging is introduced to address funding gaps, respondents agreed that it should be based on either vehicle emissions or the size and weight of the vehicle—both considered fair ways to address such gaps.